|
Figure 1 shows the composition triangle of Ge, Sb and Se with the GexSbxSe100-2x pseudo binary line and glass forming region. The glass forming region was taken from Borisova et al. 1 and Seeram et al.2 
FIGURE 1 Glasses along the tie-line joining Se to Ge1/2Sb1/2, correspond to GexSbxSe100-2x (Fig. 1), ternary, and these were synthesized in the range of 0 < x < 23% by usual melt quenching technique. Stoichiometric amounts of Ge (99.999% Alfa Aaser), Sb (99.999% Alfa Aeser) and Se (99.999% Cerac) were measured and sealed under a vacuum of 1x10⁻⁷ Torr in dry fused quartz tubings. The quartz tubings were baked at 1000C in a vacuum oven for at least a day prior to using for encapsulation of the starting materials. The atomic mass 72.61g, defines a mole of Ge. In making GexSbxSe100-2x ternary, x moles of Ge, x moles of Sb and 100-2x moles of Se were alloyed. The corresponding masses of Ge, Sb and Se were calculated to get the required molar ratio. Table 1: Temperature profile adopted in sample synthesis.
Samples were water quenched from 9500C. Raman spectra were taken along the length of a quartz ampoule to test for homogeneity. If samples were found to be inhomogeneous, they were reheated and kept at 9500C for an extended period, until samples were homogeneous. Our experience shows that samples were typically reacted for about 2 weeks to be homogeneous. After melt quenching, samples were Tg cycled (to relieve stress frozen in due to water quenching) and slow cooled to room temperature at 30C/min to have the same thermal history across various compositions, (x). |
||||||||||||
|
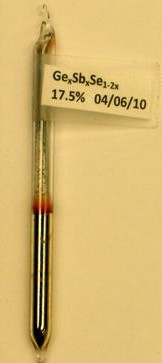
FIGURE 2: Picture of x = 0.175 sample in a quartz tube. |
||||||||||||
|
FIGURE 3
Figure 3 shows Raman spectra taken along the length of the quartz tube
at 8 locations. Panel (a) and (b) shows Raman spectra taken after 24
hours and 5 days of alloying respectively.
Note the spectra in (a) coalesce in (b) suggesting that the glass
stoichiometry ‘x’ is uniform along the quartz ampoule axis. References 1. Borisova, Z.U., Glassy semiconductors. 1981, New York: Plenum Press. ix, 505 p. 2. Sreeram, A.N., A.K. Varshneya, and D.R. Swiler, Molar volume and elastic properties of multicomponent chalcogenide glasses. Journal of Non-Crystalline Solids, 1991. 128(3): p. 294-309. |
This site was last updated 09/03/15